


The Best Performing Developer Teams Work in European Software Startups!
Insights from LinearB's 2023 Software Engineering Benchmarks Report


I had a big smile on my face when I flipped through LinearB’s 2023 Software Engineering Benchmarks Report. The company conducted a report on developer productivity based on data from 2k teams, 100k contributors, from more than 64 countries, resulting in close to 3.7m pull requests!
First things first, a quick round of applause for the busy bees driving productivity in their respective teams!

Before sharing my highlights from the report and clueing you in on why it made my day, let’s quickly look into what kind of company LinearB is and why they might be in a good position to talk about dev productivity!
LinearB is a developer productivity insights platform. It helps developers and engineering managers understand what they/the team is working on, quantify individual and teamwork, and identify blockers or productivity hurdles. It does so by connecting to your version control system and other tools in your stack such as issue trackers or knowledge platforms. Other companies with similar offerings are e.g. Jellyfish, Swarmia, Athenian, Sleuth, and some more. They might differ on frameworks used (DORA vs. SPACE) or target persona (individual developer vs. engineering manager). In many cases, companies starting to implement such a productivity insight platform, see significant improvements in throughput within weeks.
Some background information about the report
The report clusters data into 4 different performance-based groups:
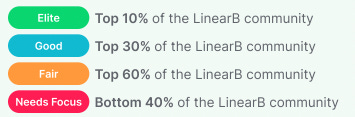
It then goes on to benchmark these groups based on a variety of metrics, including efficiency metrics (e.g. merge frequency), DORA figures, as well as quality & predictability-related criteria.
Insight 1: The gap between ‘elite’ performing engineering teams (top 10%) vs. those in the bottom 40% is extreme
I had to look twice when I compared the performance metrics of the elite teams with those in the lowest bucket because in many instances the gap is huuuuge!
One extreme example that stood out to me was the cycle time (the time needed for a single engineering task to get from code to production), where elite teams average at 19 hours, compared to 218 hours in the “needs improvement” bucket - a shocking 11.5x factor difference!
Another figure that shows just how large the divergence is, is the change failure rate (the % of deployments that cause a failure in production) where elite teams boast a stunning <1% while the lower 40% cause a failure in 39% (!) of deployments. Just imagine the rat-tail this brings along and the eventual business impact this difference can make.
Insight 2: Devs spend too much time on things that do not drive immediate business value
Even though I expected this figure to be worse, developers still spend almost half of their time on things that do not directly create new revenue-generating and thus value-adding features. Clearly too much. While I think the percentage spent on feature enhancement is less concerning and can be a bit factored out here, I think time spent on developer experience and KTLO (Keeping the Lights On) should converge towards 0. For DX the ideal scenario would be to have high standards from the get-go but also to have it sort of built-in in every new product/feature so it’s not an individual aspect per se. KTLO time for maintenance, compliance, and other adjacent tasks should be minimized. How to achieve this could be a whole new topic for another episode so we are not going into it for now.
Luckily though we at Earlybird invested in a Developer Tooling company, still in stealth mode, that is tackling exactly this picture with the aim of making the donut as purple as possible and freeing your time from non-business-value-adding tasks so you can achieve more with less! So stay tuned for the announcement. 🤫
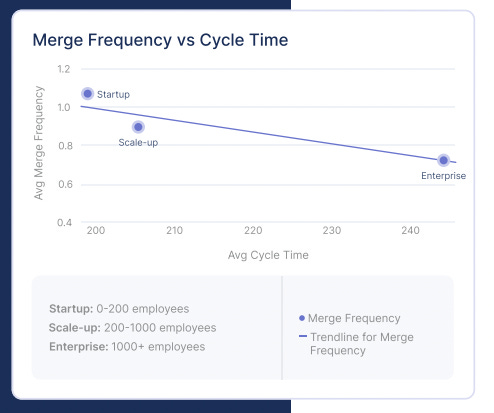
Insight 3: The average startup outperforms the average enterprise on nearly all dimensions
Are you surprised?😉 I sure am biased here but it is still great to see some validation of how the agility and leanness of a startup’s engineering team results in a remarkable performance difference compared to enterprises. Looking at cycle times, startups (201 hours) beat enterprises (243 hours) by a delta of 42 hours. I would attribute a large chunk of it to less formal processes, less red tape, and quicker decision-making, but also a less complex codebase and less tech debt.
Insight 4: Not even “elite” enterprises can keep up with their startup counterparts
This is one aspect I did not really expect. In my head, one could definitely make a case for top-tier enterprises being unmatched in developer productivity. Companies that are well known for having among the top performing engineering teams, such as UiPath, Google, HubSpot, ServiceNow, and others, will over time attract more tier-1 talent and share a relentless pursuit towards perfectness.
However, LinearB’s report contradicts my initial gut feeling that the top 10% of enterprise engineering teams, with the delta often being lower than when looking at average firms, still do not match the output of their top-performer startup counterparts.
For startups, cycle time delta is still at 8 hours (29 hours for enterprises vs. 21 for startups), PR review times are lower, deployment times as well, and they have smaller change failure rates and significantly lower rework rates. One of the very few dimensions that the enterprise side wins is the PR pick-up time.
Insight 5: Europe outperforms the US
The report further segments its metric benchmarks into regions. Interestingly, European developers outperform their North American counterparts. Looking at the elite tier again, European teams hold better cycle times and change failure rates, are on par in deployment frequency, and are just slightly worse in MTTR (Mean Time to Recovery = measuring time it takes to repair a system in downtime and restore it to functionality).
Insight 6: Software & IT developers outperform other industries
Unfortunately, the industry classification is quite high-level, split into Finance & Banking, Other, Professional Services, and Software & IT Services. The latter one is the clear winner. Given that companies in this bucket are typically the ones where the engineering teams are the #1 front-line workers and rockstars, this comes as no big surprise.
I’d love to see though how subgroups of this bucket would compare to each other, e.g. B2B vs. B2C software, or infrastructure vs. application software. Maybe something to expand to in next year’s report @LinearB?
Takeaway: What a time to be an investor in European software startups!
Combining Insights #1, #3, and #5-#6, the elite group of software startups in Europe shows the most impressive productivity stats. As an investor in exactly this group of companies, this is more than great to hear and helps me to stay bullish being long on European Venture.
An actionable takeaway for earlier-stage startups and operators would clearly be to not overhire and overscale too early. Try to keep things lean and mean for as long as possible and focus on building a high-performing team rather than just building any team quickly.